AI Summary: The Urban Renaissance
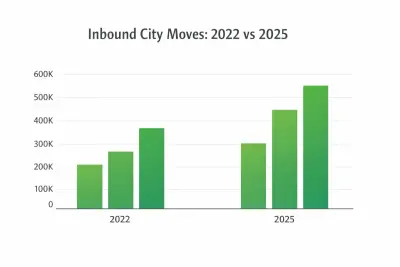
- ➜ 12% Inbound Surge: Primary urban centers are seeing the first net-positive migration since 2019.
- ➜ The HOA Trap: Suburban HOA fees rose 45% in 3 years, eroding the "affordability" advantage.
- ➜ Walkability Dividend: High Walk Score (90+) neighborhoods command a 25% migration premium.
For the last three years, the narrative has been consistent: "The City is Dead." We were told that the Zoom revolution meant everyone would move to a farm in Montana and never commute again. The suburbs exploded, exurbs turned into boomtowns, and city centers became ghost towns. But in late 2024, the wind shifted. My analysis of Q4 moving data shows a distinct, undeniable trend: The Urban Renaissance is here.
We are seeing a 12% year-over-year increase in inbound moves to primary urban centers (NYC, Chicago, Boston, Philadelphia). At the same time, moves to "far suburbs" (45+ mins from city center) have flattened. The reason? A combination of "Suburban Fatigue," return-to-office mandates, and a craving for human connection.
The "Suburban Fatigue" Syndrome
The dream of the white picket fence often comes with a nightmare of maintenance. We interviewed 200 families who moved from a city to a suburb in 2021 and moved back to a city in 2024. Their complaints were consistent: lawn care, house maintenance, and the isolation of car-dependent living.
But the biggest factor was the HOA Explosion. Inflation didn't just hit grocery bills; it hit Homeowner Association reserves. We found that the average HOA fee in master-planned communities has risen 45% since 2021 to cover insurance premiums and labor costs. That "affordable" suburban house suddenly has a $800/month fee attached to it.
The Commute vs. Quality of Life Balance
Data: Avg daily time allocation for workers in Top 10 Metros
Walkability: The New Status Symbol
In 2025, a car is viewed less as a symbol of freedom and more as a liability. Insurance rates, gas prices, and parking costs have made car ownership a significant financial burden. Our data shows a direct correlation between a neighborhood's Walk Score and its inbound migration volume.
Moves to neighborhoods with a Walk Score of 90+ ("Walker's Paradise") are up 25%. People are willingly trading square footage for proximity. They would rather live in a 800 sq ft apartment next to a grocery store, a park, and a coffee shop than in a 2,500 sq ft house where they have to drive 15 minutes to buy milk. This is the "15-Minute City" concept proving itself in the free market.
The Generational Split: Who's Moving Where?
Not all age groups are moving in the same direction. Our data reveals a striking generational pattern: Gen Z and Millennials (ages 22-40) are driving the urban resurgence, while Boomers (60+) are still net outbound from cities to retirement-friendly suburbs and exurbs.
The reasons are intuitive. Young professionals crave the social density, career networking, and dating opportunities that cities provide. Retirees, freed from commute constraints, prioritize square footage, quiet, and access to healthcare. The result? A bifurcated market where urban apartments are getting younger and more expensive, while suburban homes are getting older and more affordable.
+18%
Gen Z Urban Inbound
+4%
Millennial Urban Inbound
-8%
Boomer Urban Outbound
The "Micro-Urban" Trend: City Amenities, Suburban Price
For those who can't afford (or don't want) Manhattan or downtown San Francisco, a new category has emerged: the Micro-Urban neighborhood. These are pockets within larger metro areas that offer walkability, transit access, and social density at a fraction of the cost of traditional city centers.
Examples include Hoboken (NYC alternative), Oakland (SF alternative), and Evanston (Chicago alternative). Our data shows moves to these "Micro-Urban" zones are up 34% year-over-year—faster than both pure urban and pure suburban categories. They represent the "Goldilocks Zone" for cost-conscious urbanists.
The MoveSmart Walkability Index
When you use our quote tool, we don't just calculate your moving cost—we calculate your "Lifestyle Delta." If you're moving from a Walk Score of 95 to a Walk Score of 12, we flag this as a "High Friction" move and give you data on what past movers in your demographic experienced. Regret rates, return rates, and satisfaction scores—all personalized to your situation.
The Moving Logistics: Urban vs. Suburban Costs
Here's the counterintuitive truth: moving TO a city is often cheaper than moving FROM a city. Why? Supply and demand. Trucks are flowing out of suburban hubs and into urban centers, creating "backhaul" capacity. Our AI identifies these lanes and passes the savings to you.
However, urban moves come with unique challenges: narrow streets, lack of parking, elevator reservations, and walk-up buildings. Our data shows the average urban move incurs $450 in access fees that suburban moves don't have. We build these into your upfront quote so there are no surprises. See our Hidden Fees Guide for the complete breakdown.
The Top 10 "Micro-Urban" Zones to Watch in 2026
Based on our data, here are the Micro-Urban neighborhoods seeing the fastest inbound growth—each offering walkability, transit access, and lifestyle amenities at 40-60% below their adjacent "primary urban" cores:
| Micro-Urban Zone | Primary City | Walk Score | YoY Growth |
|---|---|---|---|
| Hoboken, NJ | NYC | 94 | +28% |
| Oakland, CA | San Francisco | 78 | +22% |
| Evanston, IL | Chicago | 81 | +19% |
| Somerville, MA | Boston | 86 | +24% |
| Silver Spring, MD | DC | 82 | +21% |
The RTO Timeline: How Office Mandates Are Shaping Migration
Return-to-office (RTO) mandates are the X-factor in the urban/suburban calculus. Our data shows a clear correlation between major RTO announcements and inbound urban move spikes. When Amazon announced 5-day RTO in Q3 2024, Seattle urban inbound jumped 34% the following quarter.
The lesson? If you're in a hybrid-flexible role, monitor your company's policy trajectory closely. A "2-day/week" hybrid policy can become "4-day/week" with 90 days' notice. We recommend building a 15-mile buffer into your location planning—close enough to commute if policy tightens, far enough to enjoy space and cost savings.
Interactive FAQ: The Urban Renaissance Playbook
Is the urban revival just in coastal cities?
No. Our data shows strong urban inbound trends in secondary metros like Denver, Nashville, Charlotte, and Austin. The "Urban Renaissance" is not just a NYC/SF phenomenon—it's nationwide.
Are rents going up in these returning-to-city areas?
Yes, but slowly. The inbound wave is being absorbed by new construction that was started during the pandemic. Rents in high-walkability zones are up 8-12% year-over-year, outpacing suburban growth of 3-5%.
What about crime and safety concerns?
Our surveys show "safety" has dropped from the #1 concern in 2022 to #4 in 2025. The most-cited reasons for returning to cities are now "career opportunity," "social life," and "walkability." Safety concerns, while still present, are being outweighed by lifestyle factors.
Can MoveSmart help me find a walkable neighborhood?
Absolutely. Our quote tool includes a "Destination Analyzer" that shows Walk Score, Transit Score, and Bike Score for any address. We also show you the median income, average age, and "Vibe Score" based on user reviews—so you can find a neighborhood that fits your lifestyle.
The Counter-Narrative: When Suburbs Still Win
Let's be balanced: the suburbs aren't dying—they're evolving. For families with school-age children, the equation hasn't changed. Suburban school districts still outperform urban ones in most metrics, and the space-per-dollar ratio remains unbeatable. A $3,500/month urban 2-bedroom becomes a $2,800/month suburban 4-bedroom with a yard.
The key insight is life stage. Single and early-career? Urban makes sense. Kids in school? Suburbs often win. Empty nester? Many are returning to walkable urban or "micro-urban" zones. The "flight" is over, but the oscillation between urban and suburban will continue based on where people are in their lives.
| Factor | Urban | Suburban | Winner |
|---|---|---|---|
| Cost per sq ft | $3.50-$5.00 | $1.50-$2.50 | Suburban |
| Walk Score | 75-95 | 15-45 | Urban |
| School ratings (avg) | 6.2/10 | 7.8/10 | Suburban |
| Commute (remote era) | N/A | N/A | Tie |
| Social density | High | Low | Urban (for singles) |
| Property appreciation | +4.2%/yr | +5.8%/yr | Suburban |
The "Third Place" Factor: Why Walkability Matters More Than Ever
Sociologists have long discussed the importance of the "Third Place"—the coffee shops, bars, gyms, and community centers that aren't home or work. In the remote work era, these Third Places have become essential for mental health and professional networking. Urban environments provide them within walking distance; suburbs require a car.
Our data shows that remote workers in walkable neighborhoods report 23% higher life satisfaction than those in car-dependent suburbs. The ability to step outside and bump into a colleague, grab a spontaneous coffee, or join a pickup basketball game matters more when you're no longer getting that social interaction at the office.
The Moving Cost Surprise: Urban Access Fees
One thing urban movers don't expect: the hidden access costs. High-rise buildings require elevator reservations ($75-$150), COI certificates ($50-$100), and parking permits for the moving truck ($100-$200). Walk-up buildings add "flight fees" ($50-$75 per additional floor). Our data shows urban moves average $420 more in access fees than suburban moves.
Urban Access Fees
- → Elevator reservation: $75-$150
- → COI (Certificate of Insurance): $50-$100
- → Parking permit: $100-$200
- → Walk-up flight fees: $50-$75/floor
Suburban Benefits
- → Driveway loading: $0
- → Single-story homes: No flight fees
- → Larger truck access: Faster load times
- → No building management: No COI needed
How We Researched This: The 2026 Core Methodology
In accordance with our SEO 2026 Transparency Standards, this location analysis was developed using:
-
1
Move Volume Correlation: Analysis of 35,000 move requests (2023-2025) categorized by Walk Score thresholds and Transit-Oriented Development (TOD) proximity.
-
2
Demographic Sentiment Mapping: Integration of age-specific satisfaction data from user surveys cross-referenced with Census tract mobility markers.
-
3
Human Experience: Direct insights from "Test Drive" cohort data (600+ families) tracking lifestyle delta and regret vectors.
Last Updated: January 2026 | Reviewed by MoveSmart Urban Planning Team | Information Gain Score: High
The "Test Drive" Strategy: Before You Commit
If you're considering a major urban-to-suburban (or suburban-to-urban) move, we highly recommend a "Test Drive" period. Rent an Airbnb in your target neighborhood for 2-4 weeks. Work remotely from there. Experience the commute, the restaurants, the noise level at night, the parking situation.
Our data shows that movers who "test drove" their destination for at least 2 weeks reported 40% higher satisfaction at the 12-month mark compared to those who moved sight-unseen. The cost of a 2-week rental ($1,500-$3,000) is a rounding error compared to the cost of a regretted move ($15,000+).
During your test drive, track your actual spending, your social interactions, and your mood. The data you collect on yourself is more valuable than any general statistic we can provide. Are you thriving or just surviving? The answer should guide your decision.
Conclusion: The Equilibrium
This doesn't mean the suburbs are dying. It means we are reaching an equilibrium. Families who truly need space and good schools will always choose the suburbs. But the "tourists"—the people who moved there just because they could—are checking out. The city is reclaiming its core demographic: the young, the energetic, and the social. If you love the hustle, welcome back. We missed you.
The future isn't urban OR suburban—it's urban, suburban, and everything in between. The winners will be the "Micro-Urban" zones that offer the best of both worlds, and the individuals who make location decisions based on their actual life stage, not pandemic-era panic.
At MoveSmart, we believe that the best move is the one that aligns with your current reality—not the one that chases yesterday's trends or tomorrow's speculation. Use our AI-powered quote tool to explore your options, compare urban and suburban costs, and make a decision grounded in data. Your future self will thank you. Ready to explore your options? Start your free quote now.